There are no items in your cart
Add More
Add More
| Item Details | Price | ||
|---|---|---|---|
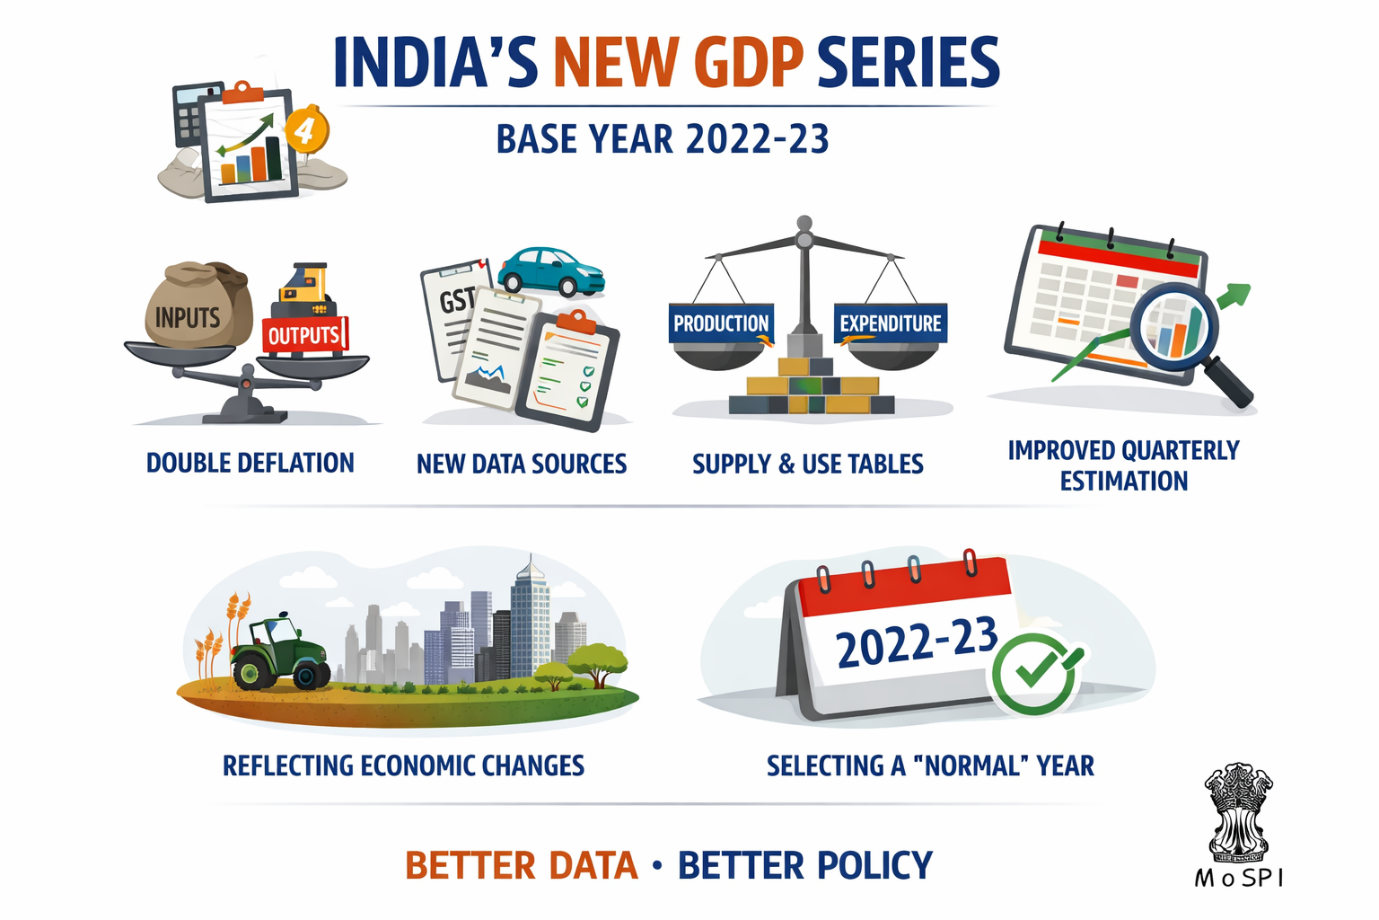
India released its GDP data for the third quarter of 2025-26 today, but this time, the numbers come with a new measuring stick. The government has shifted its GDP base year from 2011-12 to 2022-23, and along with that, it has overhauled several ways in which the economy is measured. This is not a small tweak - it is the most significant upgrade to India's national accounts in over a decade.
So What Exactly Is a Base Year?
Think of the base year as the "fixed camera" from which economists photograph the economy every year. When you want to know whether the economy actually grew or just looked bigger because prices went up, you compare everything against what things cost in one particular year - the base year. India has done this exercise before, eight times in fact, going all the way back to 1949. The shift to 2022-23 is the latest such update. The year 2022-23 was picked carefully. The pandemic wrecked 2019-20 and 2020-21. The year 2021-22 showed an artificially sharp bounce because the economy was recovering from near zero. GST was still settling in around 2017-18. After looking at all options, economists on the advisory committee agreed that 2022-23 was the most stable and representative year available.
The Old Way Had Some Problems
The previous series, based on 2011-12 prices, was increasingly out of date. India's economy in 2024 looks nothing like it did in 2011. Services now contribute more than half of GDP. Digital businesses, gig workers, delivery platforms - none of these were significant economic forces back then. The old framework was trying to measure a very different economy with outdated tools. There was another more technical problem: the way price effects were removed from the data was not precise enough. The old method used a single price index to adjust the entire manufacturing sector's output for inflation. The trouble is, the prices of what factories produce and the prices of what they buy as raw materials often move in opposite directions. Using one broad number for both created distortions.
The Biggest Fix: Double Deflation
The new series corrects this by using what statisticians call double deflation. Simply put, the output of a factory and its input costs are now adjusted for inflation separately, using their own specific price indices. This gives a more accurate picture of how much value was actually added by the manufacturing process, rather than lumping everything together. On top of this, price adjustments are now done at a far more detailed level. Over 260 separate price indices are used across different goods and services, compared to broader, aggregated measures used earlier. This means a textile factory and a chemical plant are no longer treated the same way when stripping out inflation.
Better Eyes on the Informal Economy
One of the biggest challenges in measuring India's GDP has always been the vast informal sector - the small shops, street vendors, independent contractors, and unregistered businesses that employ a huge share of the population but leave little paper trail. In the old series, this sector was estimated using data from occasional surveys and then extrapolated forward using rough indicators. The new series replaces this with two annual surveys - the Annual Survey of Unincorporated Sector Enterprises and the Periodic Labour Force Survey - which will now feed fresh numbers into the GDP calculation every year. Even gig workers driving for app-based aggregators or delivering food have dedicated codes in the new framework.
New Data Flowing In
The revised series also plugs in several data sources that simply did not exist or were not usable before. GST filings now provide a rich, real-time stream of transaction data across millions of businesses, which is being used both to estimate output and to cross-check figures from other sources. Vehicle registration data from the e-Vahan database helps estimate how much households are spending on road transport. The Public Finance Management System gives cleaner, real-time data on government spending instead of relying on estimates at the end of the financial year. Sector-specific studies on milk, fisheries, fodder, and transport services have also fed updated cost and consumption ratios into the system, replacing numbers that were years or even decades old.
Patching Up the Discrepancy Problem
GDP can be calculated in two broad ways - by adding up what is produced, or by adding up what is spent. In theory, both should give the same number. In practice, they rarely do, because data sources are imperfect and incomplete. This gap is called the statistical discrepancy. The new series addresses this using Supply and Use Tables, which essentially map out what every sector in the economy produces and what it uses. Balancing these tables forces consistency between the two approaches and dramatically reduces the discrepancy.
What Comes Next
The numbers released today cover 2022-23 to 2025-26. Historical data going further back - the back series - is expected by December 2026. States will also align their own GDP figures with the new base year once the national framework is in place. A revised GDP series does not change the actual size of the economy. But it changes how accurately we can see it. And in a country where policy on agriculture, industry, employment, and credit flows from these numbers, seeing clearly is not a small thing.